Everyday Automation
WiFi Atlas
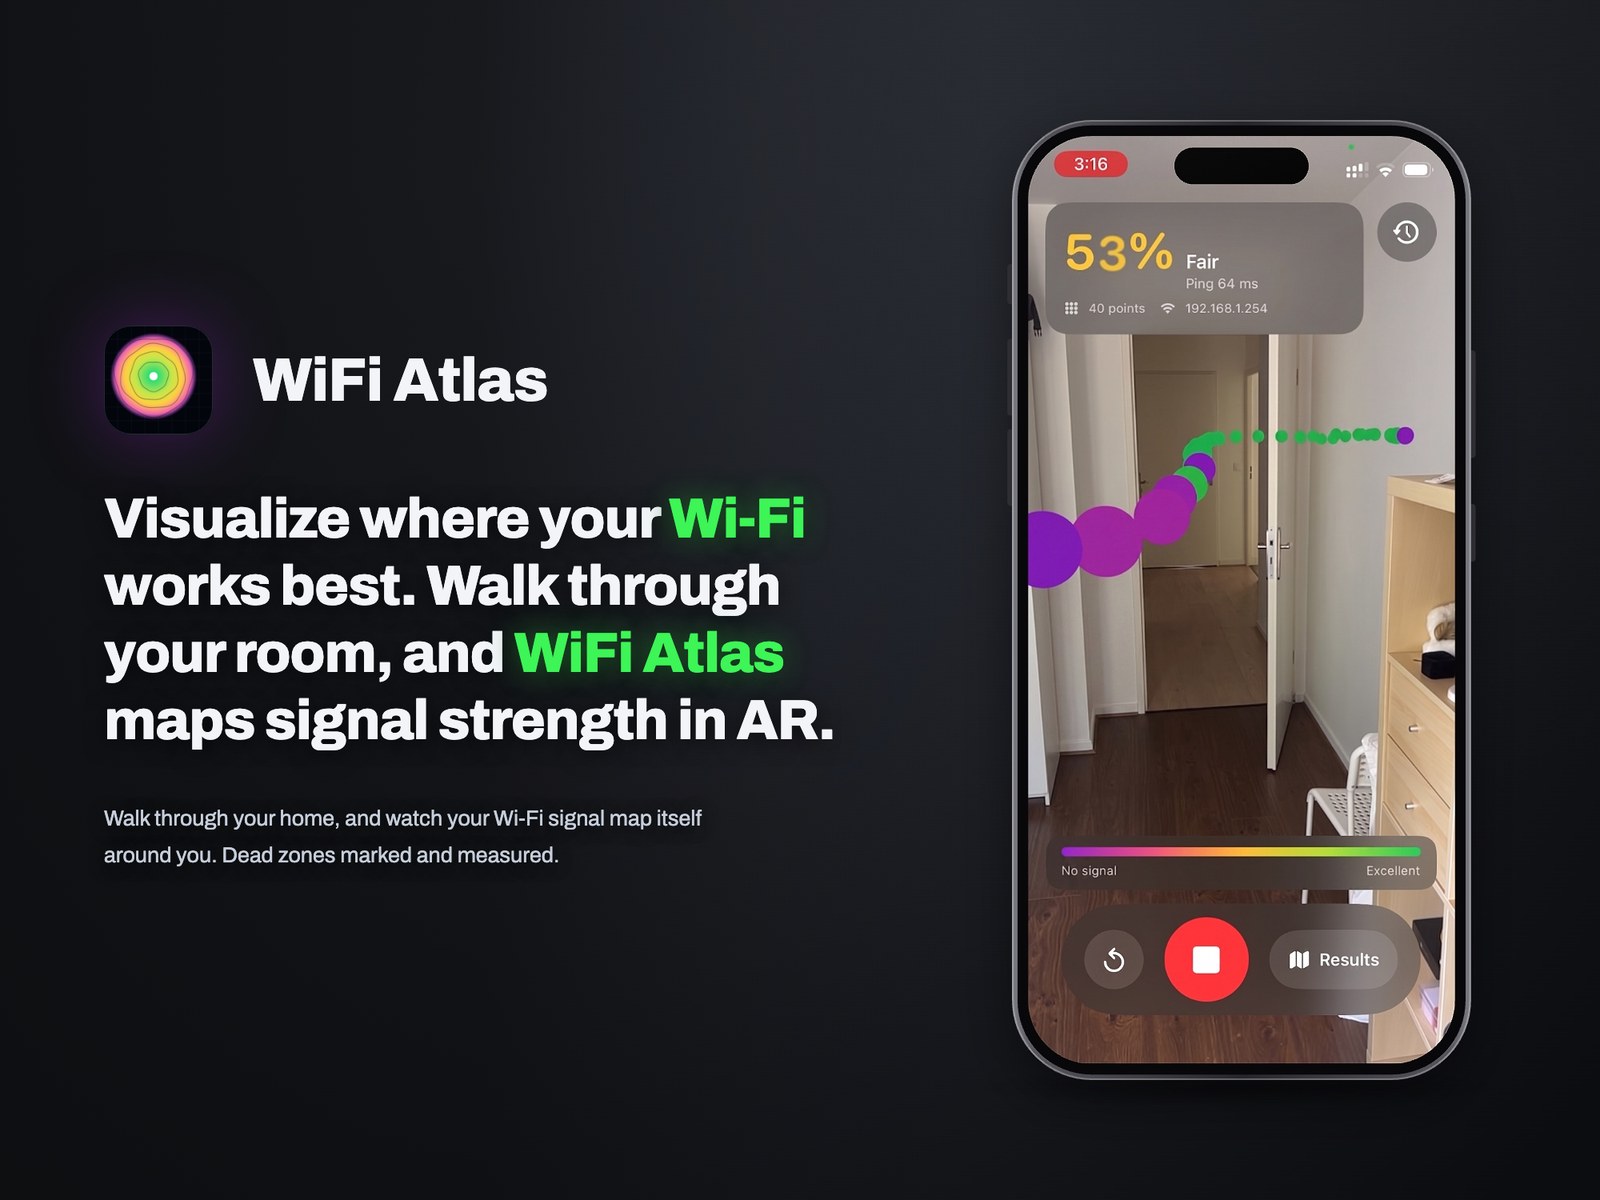
Walk your home and see Wi-Fi strength painted onto the room in AR, then as a floor map.
- Year
- 2026
- Role
- Solo — iOS app, signal pipeline, map rendering
- Status
- In development
TL;DR
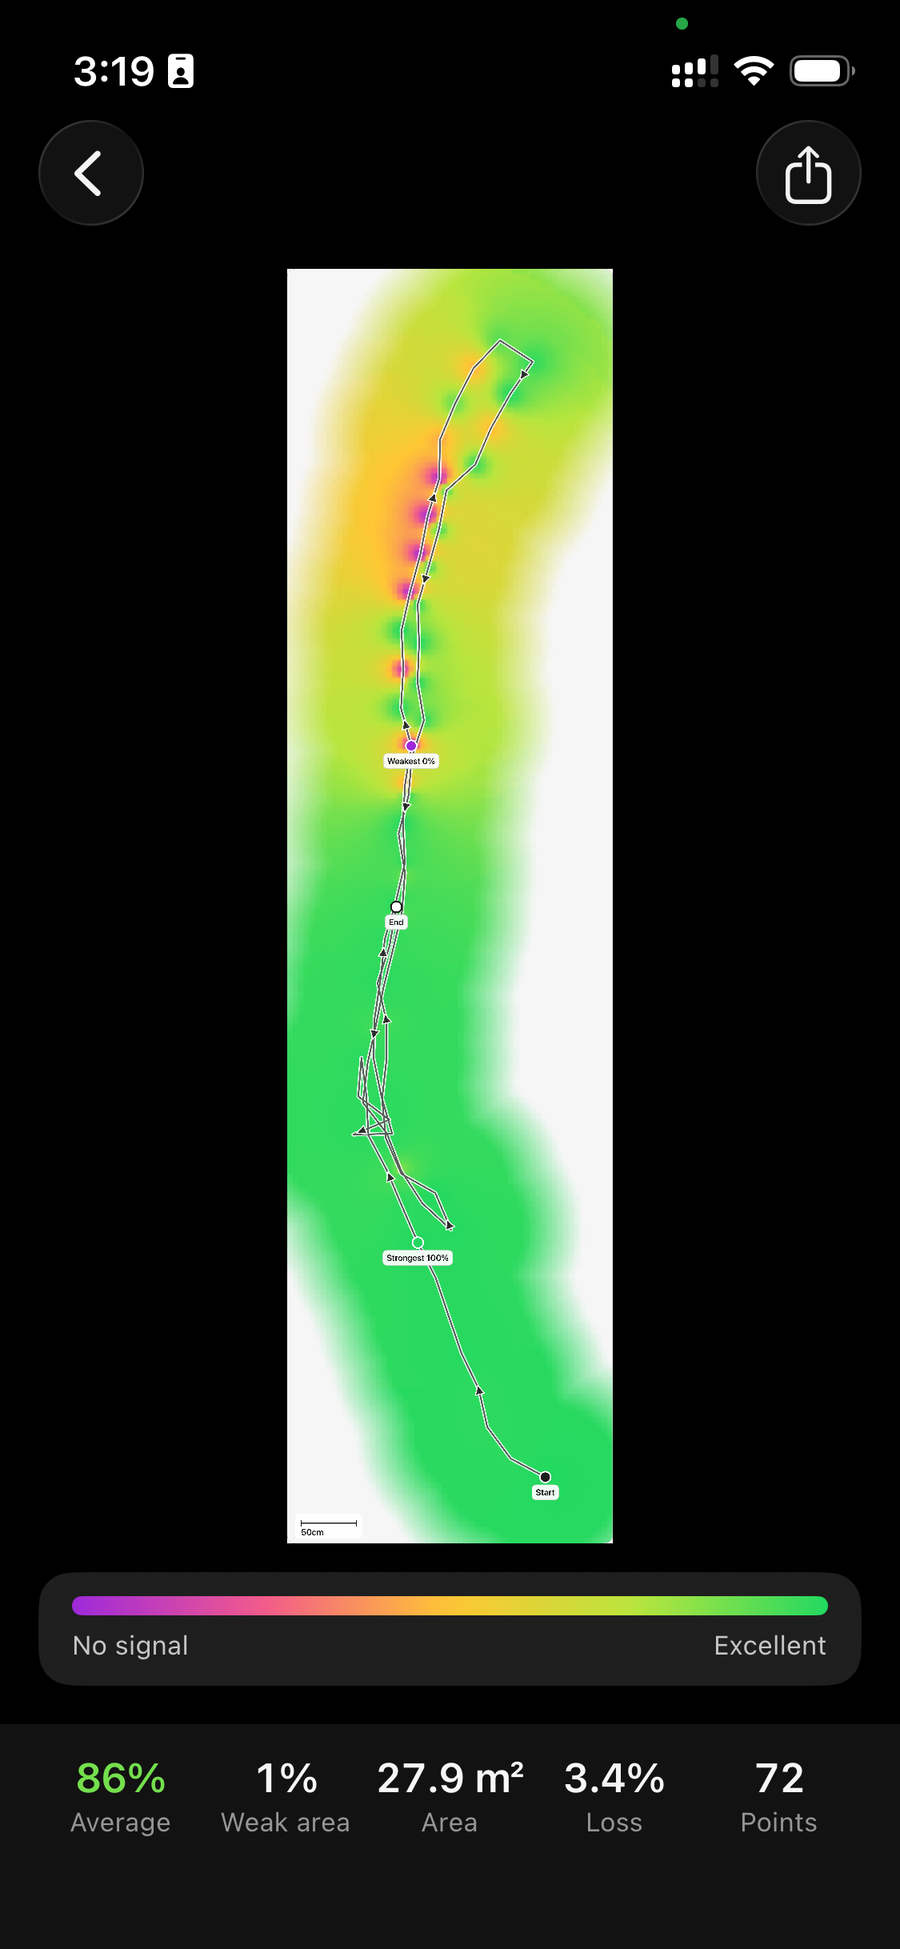
WiFi Atlas turns Wi-Fi into something you can see. Walk through your home with an iPhone and the signal is painted into the room in AR — green where it is strong, purple where it drops. Save the walk and it becomes a floor map with the dead zones marked in real metres.
What can you do with it?
Walk, see where the Wi-Fi works, and keep a map of it.
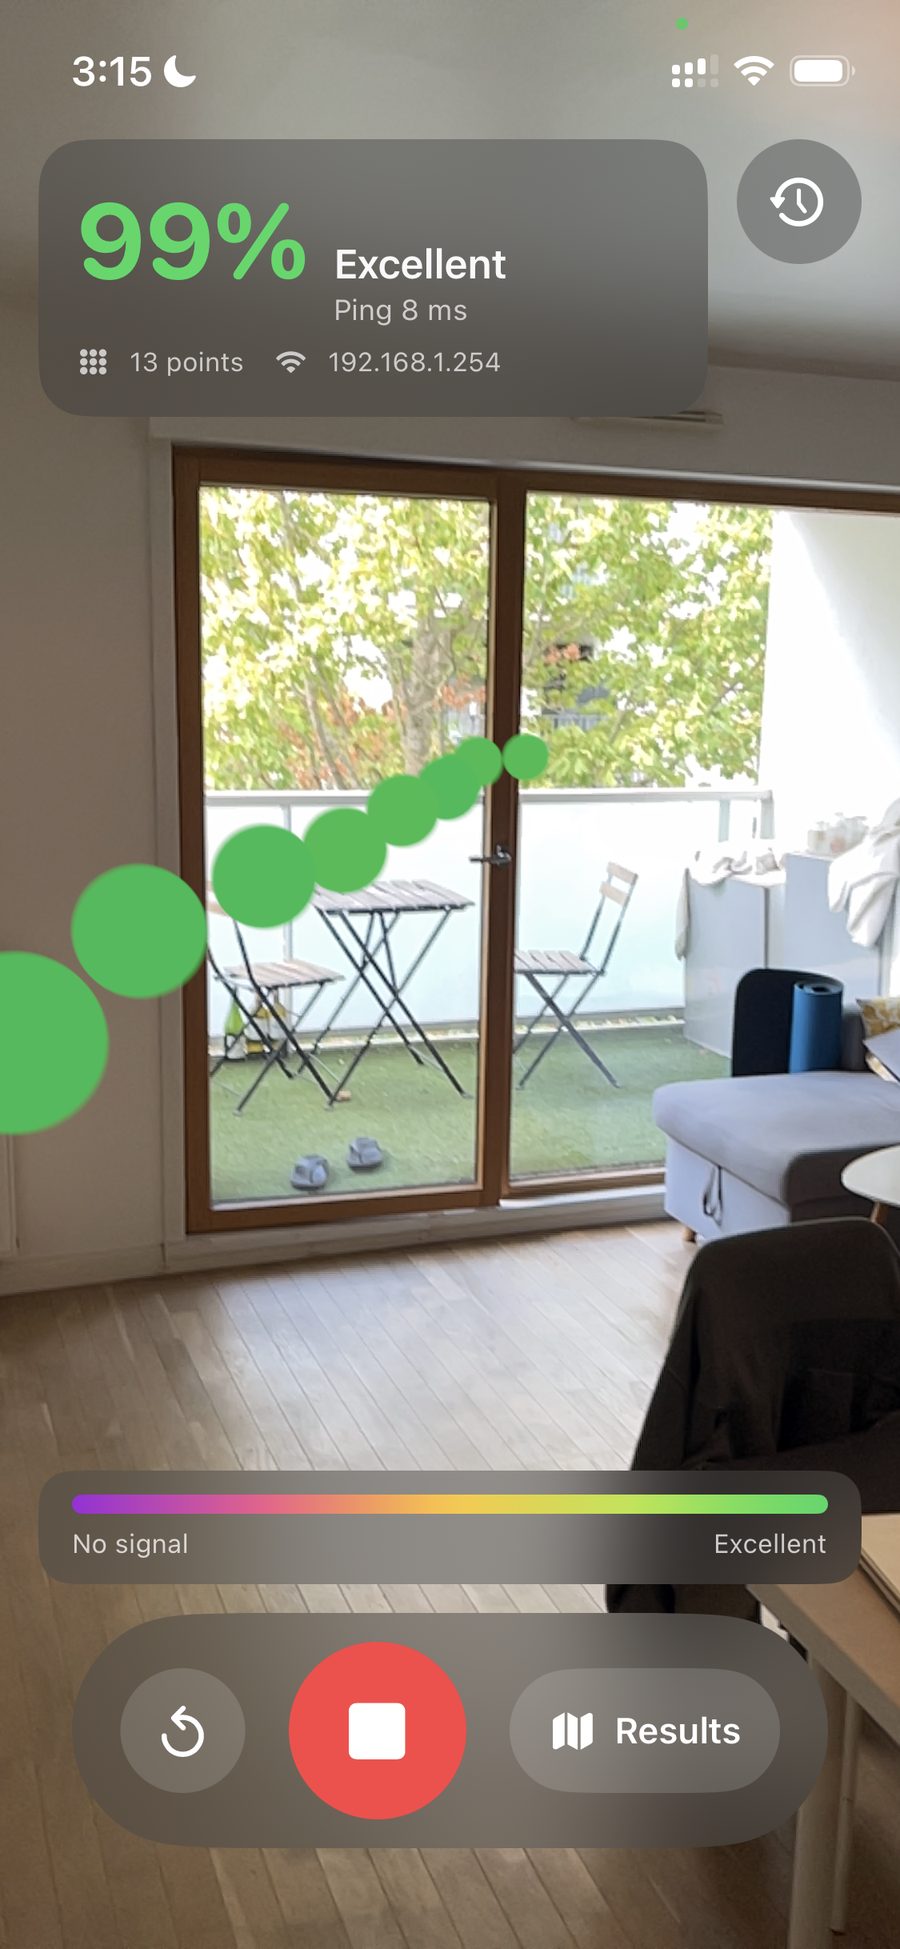
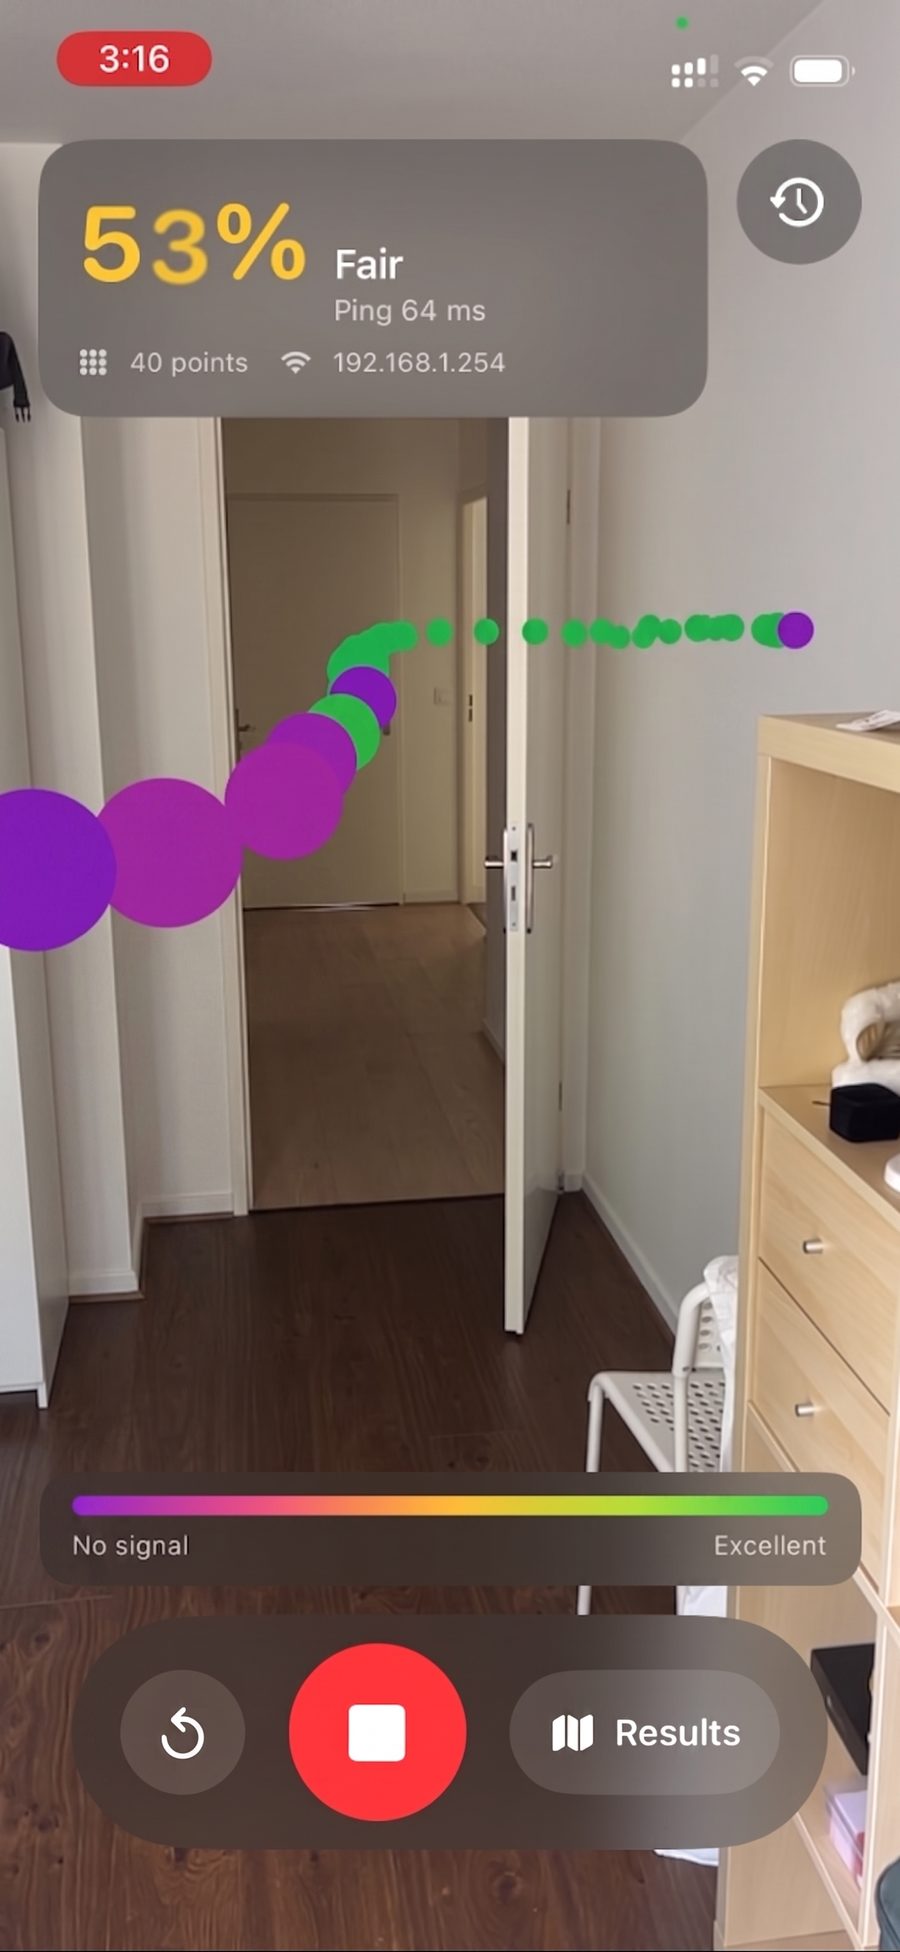
- See the signal in AR — walk around and coloured dots appear in the space behind you, from green to purple.
- Get a floor map — save the walk and it flattens into a top-down heatmap, with the weakest spot and the dead zones marked.
- Measure in real metres — the map is to scale, so you know how big the weak area actually is.
- Export it — share the map as PNG or PDF, or the raw readings as CSV.
Why it matters
Walking around a home, the Wi-Fi works in some places and drops in others — and it is hard to tell where, or to remember it later.
- Every Wi-Fi tool gives you a number for where you are standing — not a picture of the whole home.
- Turned into an image, where the Wi-Fi works is visible at a glance, and it stays on the map instead of in your memory.
- It measures what a person actually feels — delay and dropped packets — not only radio strength. A room can show full bars and still be unusable.
How it works
Three steps, from a walk to a map.
- Measure while you walk — the app keeps pinging the router and turns delay and packet loss into a 0–100% score.
- Pin each reading in space — ARKit tracks where the phone is, so every reading stays at the spot it was taken.
- Flatten into a floor map — dropping the height leaves the floor plane. Gaps between readings are filled in, and rooms nobody walked into stay blank instead of being guessed.
How was it tested, and how does it perform?
Wi-Fi changes from second to second, even standing still. So one ping never decides a spot.
- Measure continuously — the app checks the connection about three times a second while you walk.
- Combine per spot — every reading taken on the way to a spot, about every 35 cm, becomes one value: the median reply time, lowered by the share of pings that went unanswered.
| Situation | Last eight pings | Combined per spot |
|---|---|---|
| One dropped packet in a good hallway | Marked as a dead spot (0%) | Absorbed by the good readings around it |
| Just out of a dead zone, 5 ms replies | Still scored 75% | Scored as good |
| A real dead zone, every ping fails | 0% | Still 0% |
Applications
- Where to put a Wi-Fi extender — the map shows where coverage fades, so you can see where an extender should go.
- Choosing where to work — find the spot with the steadiest connection for a desk.
- Checking a new home or office — survey the space before moving in.
Future directions
- Accurate maps with LiDAR — the map now comes from the camera alone, so its shape is not exact. LiDAR was tried and set aside so every phone behaved the same; bringing it back where available would sharpen the map.
- Across floors — going down a floor breaks the map, and two storeys in one walk stack on top of each other from above.
- Walls in AR — the camera does not know where walls are, so dots behind a wall show through it in the AR view.
Behind the project — how it started and how it changed
The problem
Parts of our apartment had Wi-Fi and parts did not, and I had no way to see where the boundary was. Every tool I could find gave me a number for where I was standing. I wanted to look at the problem, not read it.
WiFi Atlas measures connection quality continuously while you walk and paints the result into the space behind you in augmented reality — green for strong, yellow for fair, purple for no signal. Save the walk and it flattens into a top-down floor map: a coverage heatmap with the dead zones outlined and measured in real metres. Surveys never leave the device.
How it changed
Each version below exists because the one before it was wrong about something specific.
- v1
Read the radio directly
- Why
- The obvious measurement is RSSI — the actual radio signal strength of the connected network.
- Change
- Built `HotspotSignalSource` on `NEHotspotNetwork.fetchCurrent`, normalising raw signal strength to a 0–1 score that drives the colour ramp.
- Result
- It works, but it needs the Access WiFi Information entitlement, which needs a paid developer account, plus location permission before iOS will disclose the connected network at all. On a free account the app simply has nothing to draw. iOS also refuses to scan neighbouring access points at all, so 'where is my Wi-Fi weak' is answerable and 'am I clashing with my neighbour's channel' is not.
- v2
Measure the experience instead of the radio
- Why
- A survey tool that requires an entitlement most people cannot get is a survey tool nobody runs.
- Change
- Added `GatewaySignalSource`, which sends ICMP echoes to the router and derives a score from round-trip time and packet loss. No entitlement required. Both sources sit behind one `SignalSource` protocol, and `CompositeSignalSource` silently picks whichever currently works — promoting to the radio source mid-scan if permission is granted later, without restarting the walk.
- Result
- The app now runs on a free Apple ID. It also measures a subtly different and arguably more honest thing: experienced quality rather than radio strength. A room can show four bars and still be unusable, and the latency probe catches that where RSSI does not.
By the balcony — 99%, 8ms. Same walk, one wall further in — 53%, 64ms. The trail turning purple is the dead zone appearing in real time.
Where it landed
The fallback stopped being a fallback. Latency to the gateway is what a person actually feels, so shipping it as a first-class source made the map more useful, not less — and made the whole app installable by anyone with an iPhone and no developer account.
The parts that can be verified without hardware are covered by 155 tests: normalisation and the colour ramp, immutability of the survey model, storage round-trips, the source-fallback policy, IPv4 and subnet arithmetic, ICMP packet framing, and the map projection, rotation, IDW interpolation and coverage masking.
Built with
- Swift
- ARKit
- RealityKit
- ICMP / networking
- Swift Testing