Everyday Automation
Purrtector
A litter box activity tracker that watches for feline cystitis: every visit and Milo's weight, logged by a scale under the box.
- Year
- 2025~now
- Role
- Solo — firmware, dashboard, printed mounts
- Status
- In development — hardware being assembled
TL;DR
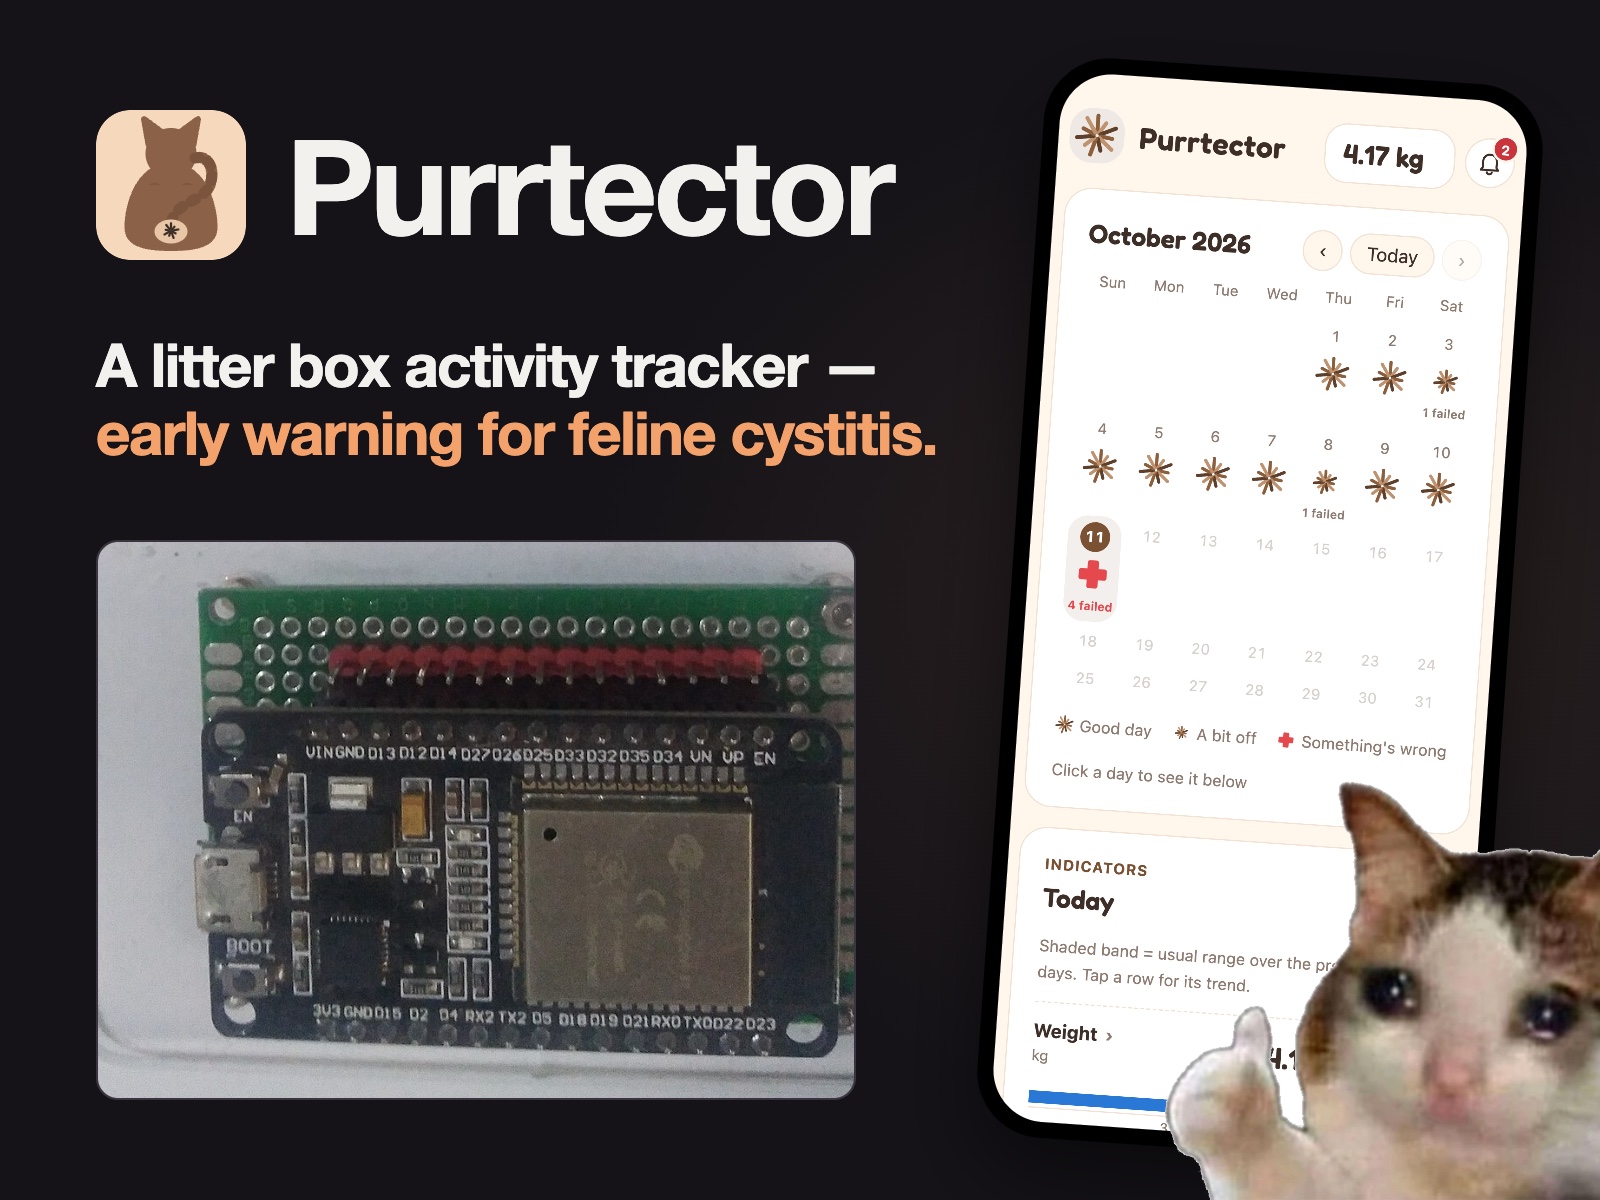
A litter box monitor built to help prevent cystitis in my cat. An ESP32 and load cells under the box track his body weight and toilet activity.
Dashboard
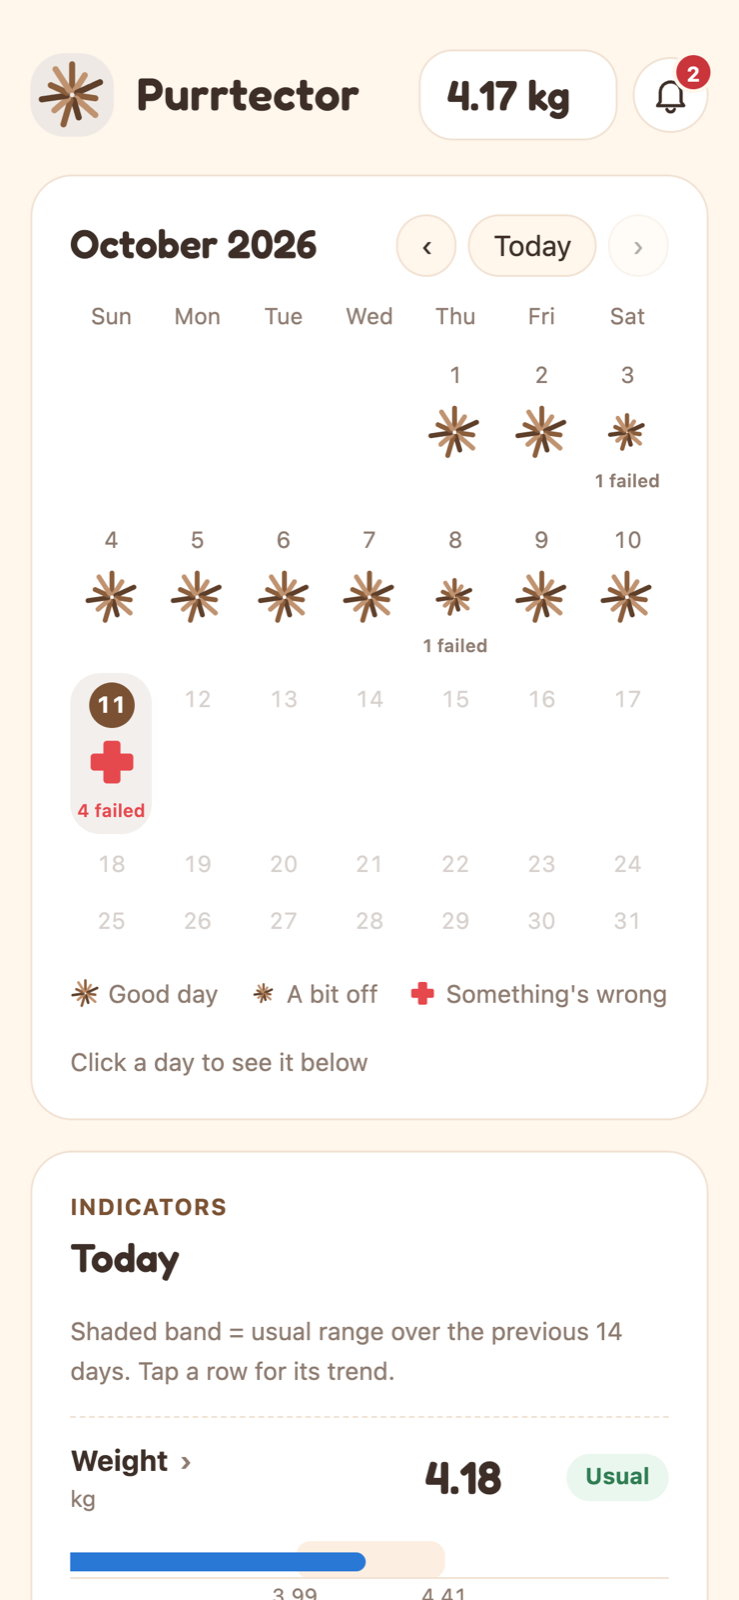
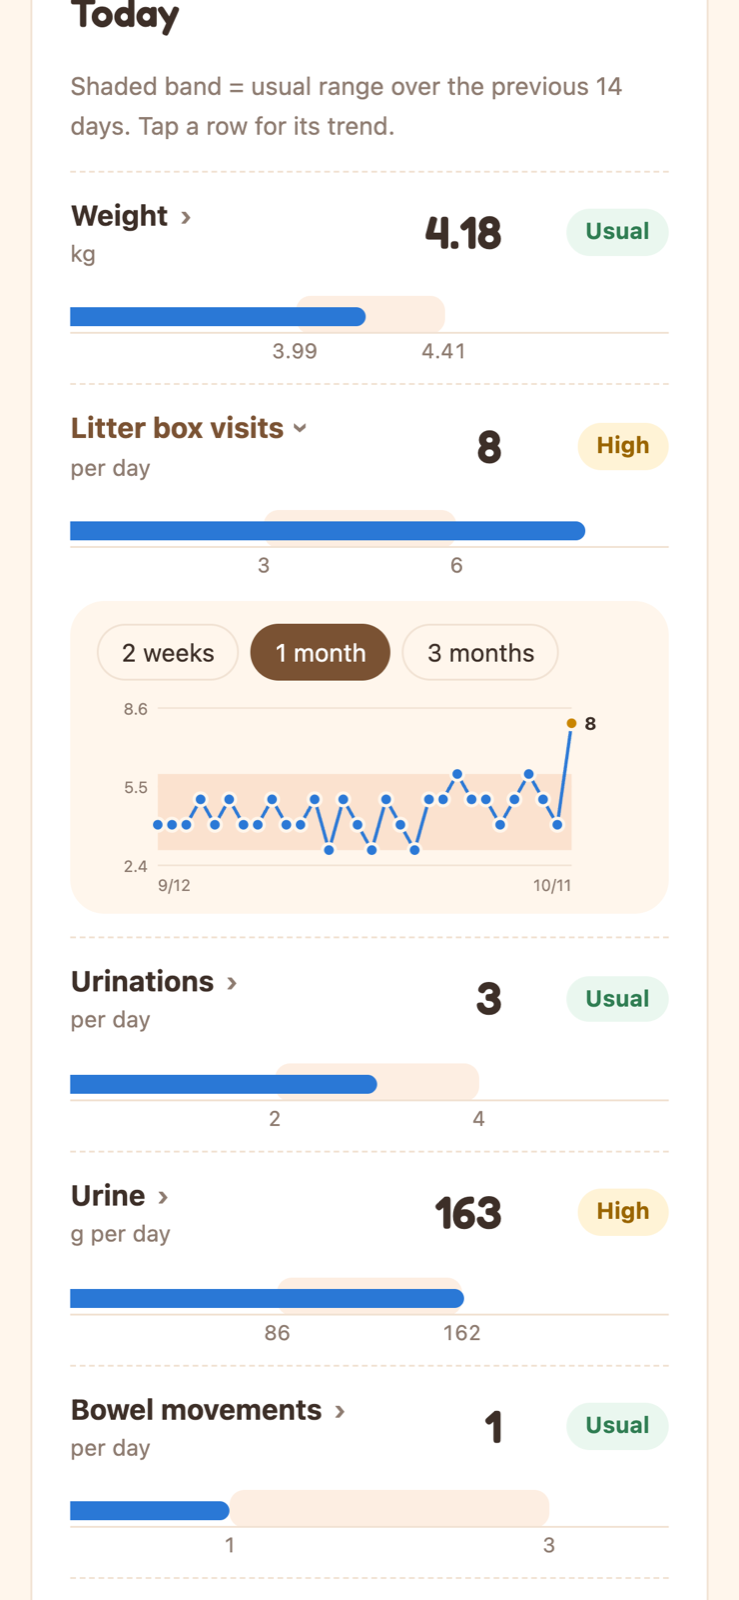
Built phone-first: one column, and every indicator opens its own trend in place.
- Calendar — one mark per day from the day's status: asterisk for normal, a smaller one for a warning, a red cross for danger.
- Indicator sheet — the selected day's eight values, each as a bar against the 14-day band. Tap a row and its trend opens under it, over 2 weeks, 1 month or 3 months.
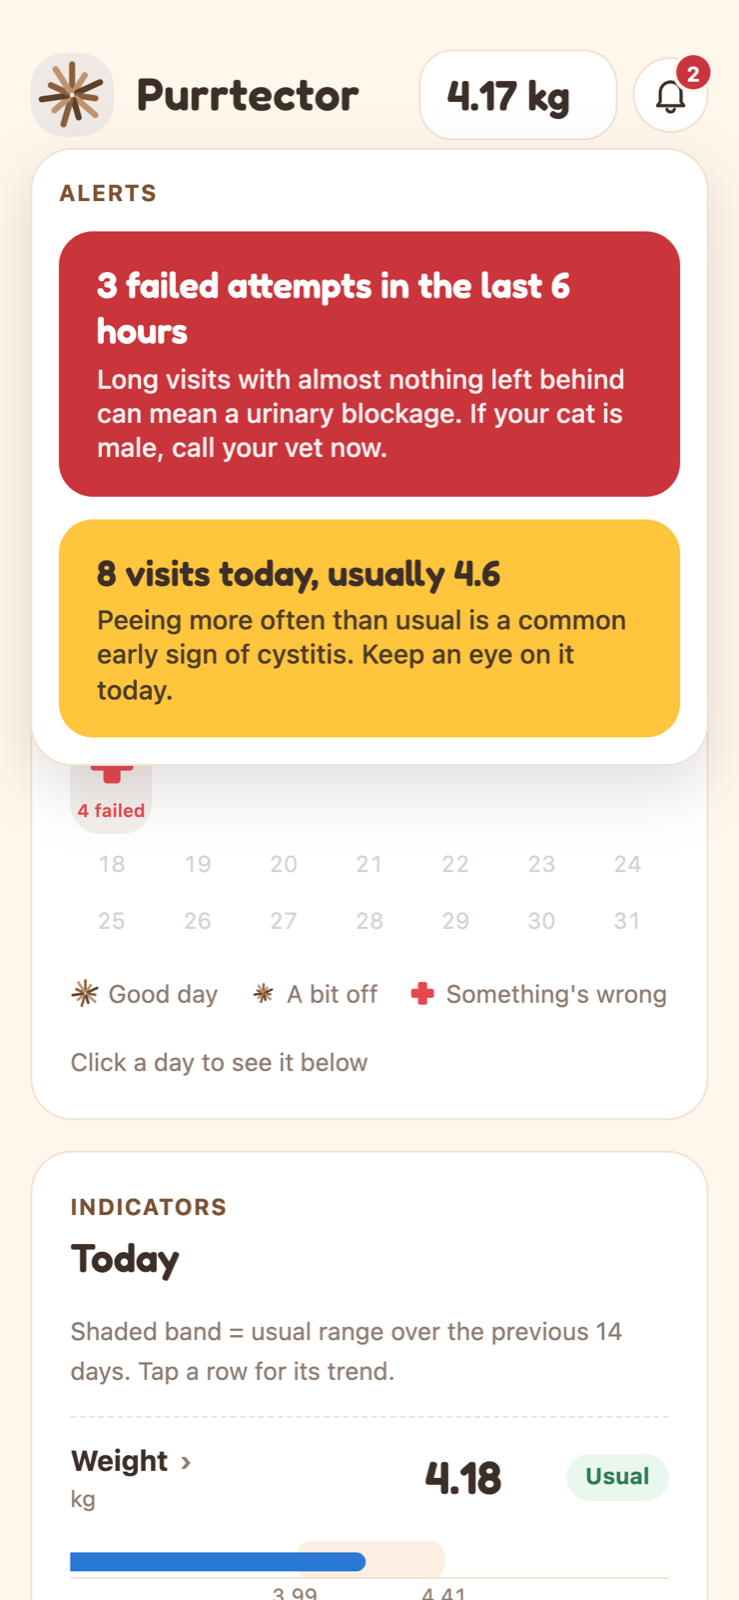
- Alerts — behind the bell, ordered by severity.
- Log — every visit of the day, with a tag control that feeds the urine/stool model.
Circuit
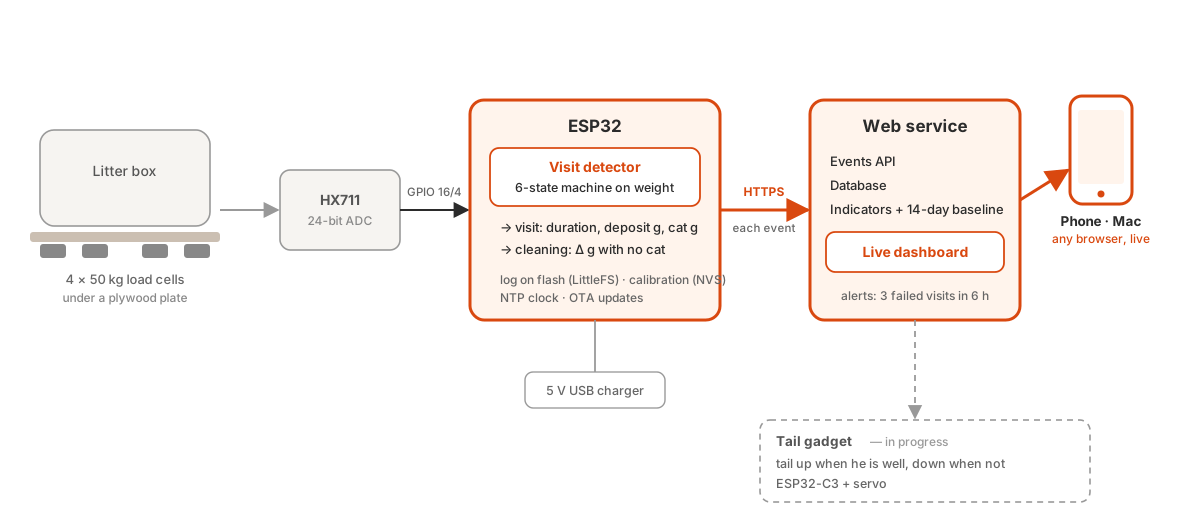
Load cells under the box, an ESP32 that detects visits, and a web service the phone reads.
- Sensing — four 50 kg load cells into an HX711.
- ESP32 — detects each visit and logs it.
- Web service — stores events and serves the dashboard to the phone.
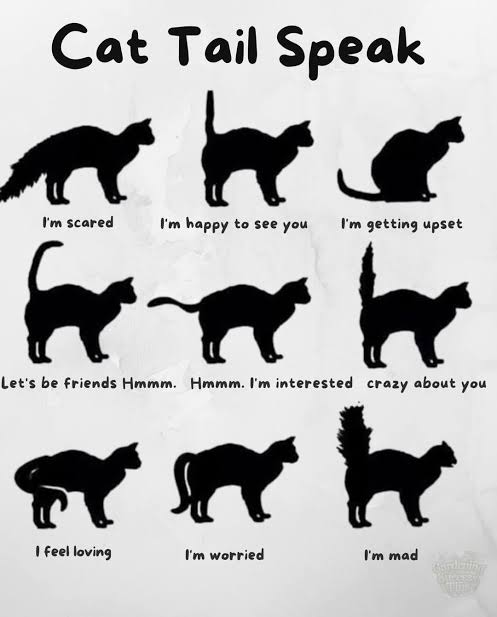
- Tail gadget — a tail that rises when he is well and drops when something is off, so his health reads at a glance without opening the dashboard. Still being built.
Algorithm
One weight signal is turned into events on the device, and events into daily judgements in the browser.
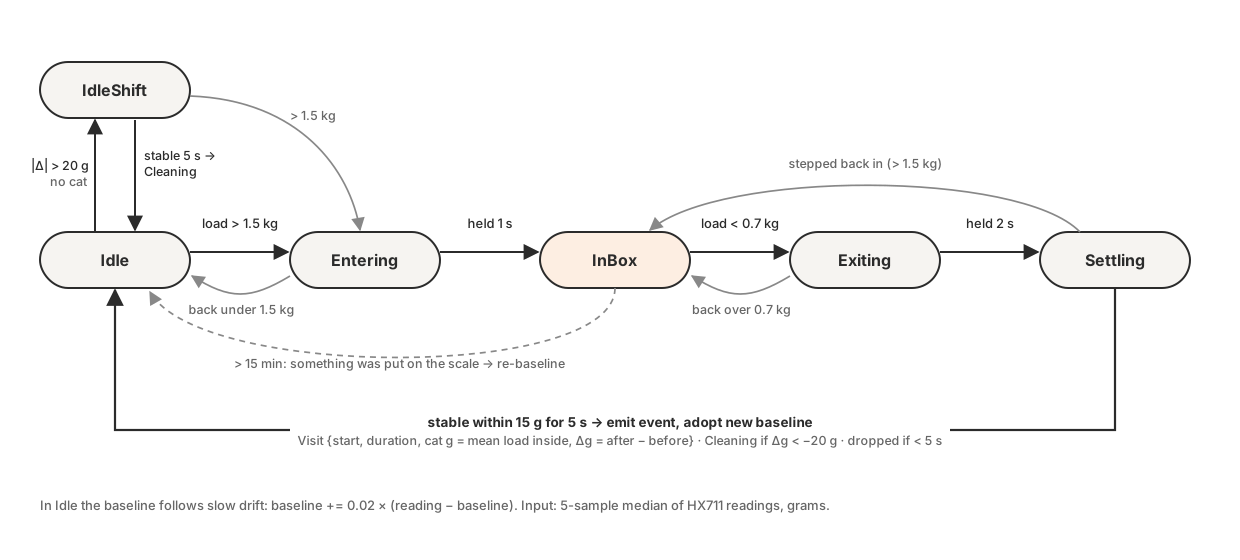
- Visit detection (C++, on device) — a state machine over the smoothed weight. Over 1.5 kg for 1 s means a cat is in; under 0.7 kg for 2 s means it left; the box must then hold within 15 g for 5 s. The settled difference is the deposit, the mean load while inside is the cat's weight. Visits under 5 s are dropped.
- Cleaning and drift — a change over 20 g with no cat is logged as cleaning, as is a press that leaves the box lighter. Idle drift is tracked with an EMA (α = 0.02). A “visit” over 15 minutes is an object on the scale and triggers a re-baseline.
- Classification — deposit under 10 g: a failed attempt (or a hop-in if under 30 s). Urine and stool weigh alike, so visits I tag train a nearest-centroid model on log mass and log duration; after five of each it labels the rest as estimates.
- Personal baseline — eight daily indicators, each judged against the mean ± spread of the cat's own previous 14 days (defaults until 3 days exist; count bands rounded to whole numbers).
- Alerts — three failed attempts within 6 h is danger; any failure, 1.5× the usual visits, or 12 h without output is a warning.
Stack
| Layer | What is used |
|---|---|
| Sensing | 4 × 50 kg half-bridge load cells, HX711 (bogde/HX711), median filter |
| Firmware | ESP32 Arduino core on PlatformIO, C++ |
| Storage | LittleFS (events.csv, labels.csv), NVS for calibration |
| Network | Wi-Fi STA, HTTPS event upload, NTP time, ArduinoOTA |
| Web service | Events API, database, dashboard served to phone and laptop |
| Dashboard | Vanilla JS + hand-written SVG charts, phone-first layout, no build step |
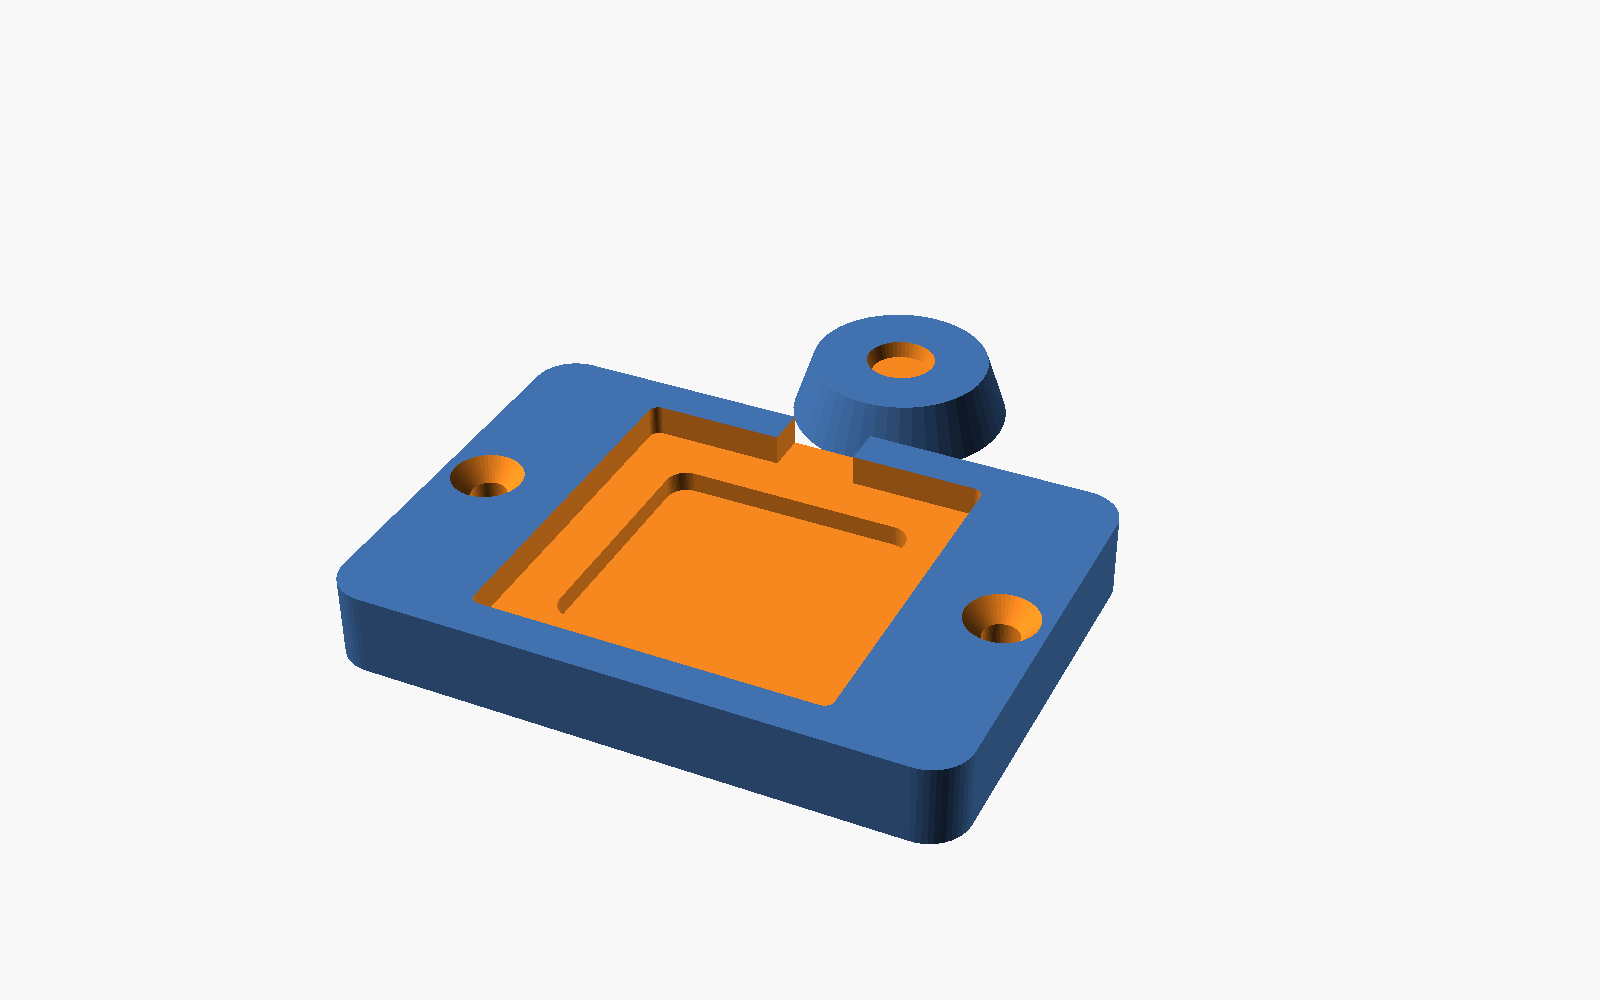
| Hardware | OpenSCAD, 3D-printed PETG holders |
| Tests | g++ with ASan/UBSan for the detector and alert logic; Node for dashboard metrics; Python mock device |
Behind the project — how it started and how it changed
The problem
Male cats have a narrow urethra, and cystitis can block it within days. The early signs are behavioural — more visits, longer stays, less output — so the project measures exactly those, plus body weight, with nothing but a scale.
How it changed
Each version below exists because the one before it was wrong about something specific.
- v0retired
ToF sensor at the entry
- Why
- Wanted presence detection independent of weight.
- Change
- Planned a time-of-flight sensor on the lid.
- Result
- Cut before building: a 1.5 kg step on the scale already marks presence.
- v0retired
Cloud backend and push alerts
- Why
- The default IoT design ships every event to a server.
- Change
- Sketched a hosted database and notifications.
- Result
- Cut for v1: the ESP32 kept the log on flash and served the dashboard on the home Wi-Fi only.
- v1
Single weight signal, on-device state machine
- Why
- Presence, duration, deposit and cat weight all have to come from one signal.
- Change
- Six-state detector in plain C++, LittleFS log, browser-side indicators with a 14-day personal baseline.
- Result
- Firmware builds; 46 host-run tests pass against simulated traces and a mock device. Hardware assembly is next.
- v2
Web service, live on the phone
- Why
- A dashboard that only works at home is no use when the warning comes while I am out.
- Change
- The ESP32 posts each event over HTTPS to a web service that stores them, computes the indicators and serves the dashboard.
- Result
- In progress.
Built with
- ESP32
- C++ / PlatformIO
- HX711 + load cells
- LittleFS
- HTTPS / OTA
- Web service
- JavaScript
- SVG charts
- OpenSCAD
- 3D printing